6-Band frequency decomposition
Audio is separated into Sub, Bass, Low-Mid, Mid, High-Mid, and Treble energy bands. Low-end blooms drive spatial expansion while high transients trigger particle bursts.
Real-Time Audio Visualizer
PulseKani is a live audio visualizer engineered for any sound happening right now: spoken voice, acoustic instruments, synthesizers, ambient field recordings, browser tabs, and multiple simultaneous inputs.
Most online visualizers take an audio file, measure overall volume, and bounce generic bars. PulseKani runs a comprehensive client-side DSP pipeline that breaks each input into rich musical and acoustic signals:
Audio is separated into Sub, Bass, Low-Mid, Mid, High-Mid, and Treble energy bands. Low-end blooms drive spatial expansion while high transients trigger particle bursts.
Measures the rate of spectral change (flux) and brightness (centroid). Timbral shifts modulate color gradients, geometry warping, and turbulence in real time.
Detects percussive attack events and dynamic impulses, driving instant physical shockwaves and flares without relying on questionable beat-detection assumptions.
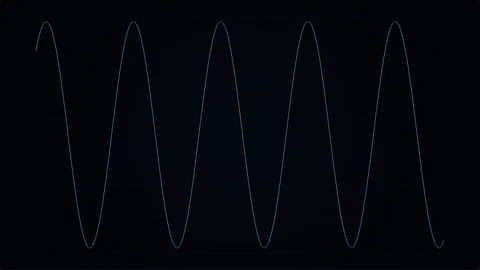
Scenes like Oscilloscope render direct sample-accurate waveform ribbons and X/Y stereo phase Lissajous figures, ideal for monitoring synthesizers and vinyl.
PulseKani is one of the few instruments built from the ground up for multi-source audio. Never collapse your audio before analysis. When you bring two or more sources into PulseKani, each stream maintains its own independent DSP pipeline:
Visualize spoken words or vocals alongside a background music track. Vocal energy can drive color and central particles while the music drives the ambient geometric stage.
Connect two independent turntable or mixer channels. In the Collision scene, their energy fields meet, repel, and trigger dynamic spectral flares when both are active.
Plug in an electric guitar or keyboard through a USB interface while playing a backing track from your browser. In Source Constellation, each source forms a celestial body connected by rhythm.
In Split Field, each participant or microphone owns a distinct living region of the visual output, creating an expressive real-time audio visualizer for podcasts and live streams.
A music visualizer typically focuses on song playback from files. An audio visualizer handles any audio stream—including live voice, instruments, ambient room noise, system sound, or multiple simultaneous inputs with precise frequency response.
No. PulseKani runs entirely inside your browser's Web Audio thread. Live microphone and interface signals are processed with minimal buffer latency, keeping visual responses synchronized with what you hear.
Yes. You can use the Share browser audio feature to capture sound from any audio-playing browser tab or desktop application that exposes an audio track in the browser's sharing dialog.
PulseKani is a live visual instrument, not a technical metering suite like TrueRes. It is designed for expressive, aesthetic audiovisual performance and live experiences rather than LUFS loudness mastering or forensic spectrum analysis.